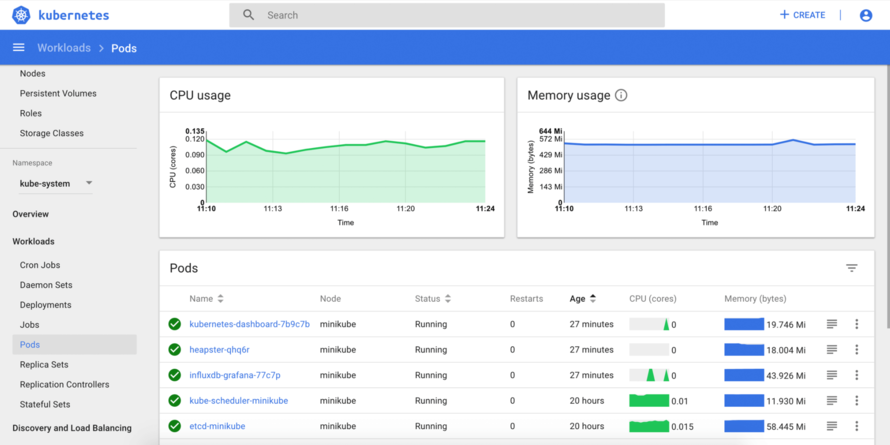
Kubernetes comes with a pretty nice dashboard to view clusters, worker groups, nodes and pods. As well as a ton of other useful things.
This tutorial presumes that you already have a Kubernetes cluster setup
and running and have access to it through kubectl in your command-line.
Steps to run Kubernetes Dashboard
Start by downloading the metrics-server and applying it to your kubectl config.
DOWNLOAD_URL=$(curl -Ls "https://api.github.com/repos/kubernetes-sigs/metrics-server/releases/latest" | jq -r .tarball_url)
DOWNLOAD_VERSION=$(grep -o '[^/v]*$' <<< $DOWNLOAD_URL)
curl -Ls $DOWNLOAD_URL -o metrics-server-$DOWNLOAD_VERSION.tar.gz
mkdir metrics-server-$DOWNLOAD_VERSION
tar -xzf metrics-server-$DOWNLOAD_VERSION.tar.gz --directory metrics-server-$DOWNLOAD_VERSION --strip-components 1
kubectl apply -f metrics-server-$DOWNLOAD_VERSION/deploy/1.8+/
Next, we will start setting up the metrics-server, ready for action!
kubectl get deployment metrics-server -n kube-system
Now apply the recommended configuration directly to your local kubectl:
kubectl apply -f https://raw.githubusercontent.com/kubernetes/dashboard/v2.0.0-beta8/aio/deploy/recommended.yaml
At this stage, we need to create a eks-admin-service-account.yaml. Once you have done this, put the following code in the newly created file:
apiVersion: v1
kind: ServiceAccount
metadata:
  name: eks-admin
  namespace: kube-system
---
apiVersion: rbac.authorization.k8s.io/v1beta1
kind: ClusterRoleBinding
metadata:
  name: eks-admin
roleRef:
  apiGroup: rbac.authorization.k8s.io
  kind: ClusterRole
  name: cluster-admin
subjects:
- kind: ServiceAccount
  name: eks-admin
  namespace: kube-system
We are now able to apply this configuration to our local kubectl:
kubectl apply -f eks-admin-service-account.yaml
Next, we will need to query the system to get an authorization token which we will use to login to the dashboard:
kubectl -n kube-system describe secret $(kubectl -n kube-system get secret | grep eks-admin | awk '{print $1}')
This command will print out a whole bunch of stuff. It will look something like this:
Name:         eks-admin-token-hdwhb
Namespace:    kube-system
Labels:       <none>
Annotations:  kubernetes.io/service-account.name: eks-admin
              kubernetes.io/service-account.uid: adf46a76-5e04-11ea-b83c-0a643b334a90

Type:  kubernetes.io/service-account-token

Data
====
ca.crt:     1025 bytes
namespace:  11 bytes
token:      eyJhbGciOiJSUzI1NiIsImtpZCI6IiJ9.eyJpc3MiOiJrdWJlcm5ldGVzL3NlcnZpY2VhY2NvdW50Iiwia3ViZXJuZXRlcy5pby9zZXJ2aWNlYWNjb3VudC9uYW1lc3BhY2UiOiJrdWJlLXN5c3RlbSIsImt1YmVybmV0ZXMuaW8vc2VydmljZWFjY291bnQvc2VjcmV0Lm5hbWUiOiJla3MtYWRtaW4tdG9rZW4taGR3aGIiLCJrdWJlcm5ldGVzLmlvL3NlcnZpY2VhY2NvdW50L3NlcnZpY2UtYWNjb3VudC5uYW1lIjoiZWtzLWFkbWluIiwia3ViZXJuZXRlcy5pby9zZXJ2aWNlYWNjb3VudC9zZXJ2aWNlLWFjY291bnQudWlkIjoiYWRmNDZhNzYtNWUwNC0xMWVhLWI4M2MtMGE2aaaaaaaaaTHISISNOTREALaaaaaaacnZpY2VhY2NvdW50Omt1YmUtc3lzdGVtOmVrcy1hZG1pbiJ9.IvE5iqK28jzi5L5DfsdGXA3I37CRQg8osNxpFegrLsCTFHDwmuFjX4Xey5a9P5Ombv8ZiYXPr_BWD49cx_hREy3Kbd6xf8NrSwr6rewPnVGejaD7k_xhl1knm2UXcDl_baOIwBUpnD1ouscRfb2ZTJTs4fri0UY9p63r7Cr8wRuZSFWLCbhqmgAWF_-JX4YcPDRwHwdFw0BoJDd3YMrBmIJ_KC8BYwo1oEucJxEfTYWWJjMbugh5hVNaVSVRwKNnrBFqSksx9iQQcPb2e_kdpobIvEQxX4-26gpRw0LfX5AXofqJ8uJelmghsn0ES8j2pqzY-x_A2_i9mEozbmXHDg
Finally, we can run the proxy command to serve the dashboard via HTTP:
kubectl proxy
How to view the dashboard
The dashboard is now available at the following location:
You will then be presented with this screen:

This is where we will select “Token” and paste in our token that was just given to us in the command-line:

Click “Sign in” and you’re ready to roll!

